Highlights
Over £1.1 billion of long duration capital raised organically.
AUM1
(31 March 2024: £12.1bn)
FUM1
(31 March 2024: £8.4bn)
Total revenue
(FY24: £141.3m)
Recurring revenues1
(FY24: 87%)
Core EBITDA pre-SBP1
(FY24: £59.3m)
Core EBITDA pre-SBP margin1
(FY24: 42.0%)
Total comprehensive income
(FY24: £24.8m)
Adjusted profit1
(FY24: £44.7m)
Adjusted EPS1
(FY24: 38.6p)
1. Alternative performance measures.
Alternative performance measures (“APMs”) have been included to better reflect the Group’s underlying activities. Whilst appreciating that APMs are not considered to be a substitute for, or superior to, IFRS measures, the Group believes their selected use may provide Stakeholders with additional information which will assist in their understanding of the business. In particular, the Group believes core EBITDA pre-SBP reflects the trading performance of the underlying business without distortion from the uncontrollable nature of the share-based payments charge. Recurring revenues % is recurring revenue divided by total revenue.
Note
Certain data contained in this document, including financial information, has been subject to rounding adjustments. As a result of this rounding, the totals of data presented in this document may vary slightly from the actual arithmetic totals of such data. In certain statistical and operating tables contained in this document, the sum of numbers in a column or a row may not conform to the total figure given for that column or row. Percentages in tables and elsewhere in this document may have been rounded and accordingly may not add up to 100%.

The Group’s focus on managing long duration capital, combined with a multi‑faceted fundraising pipeline across both institutional and retail vehicles, consistently delivers growth through economic cycles.
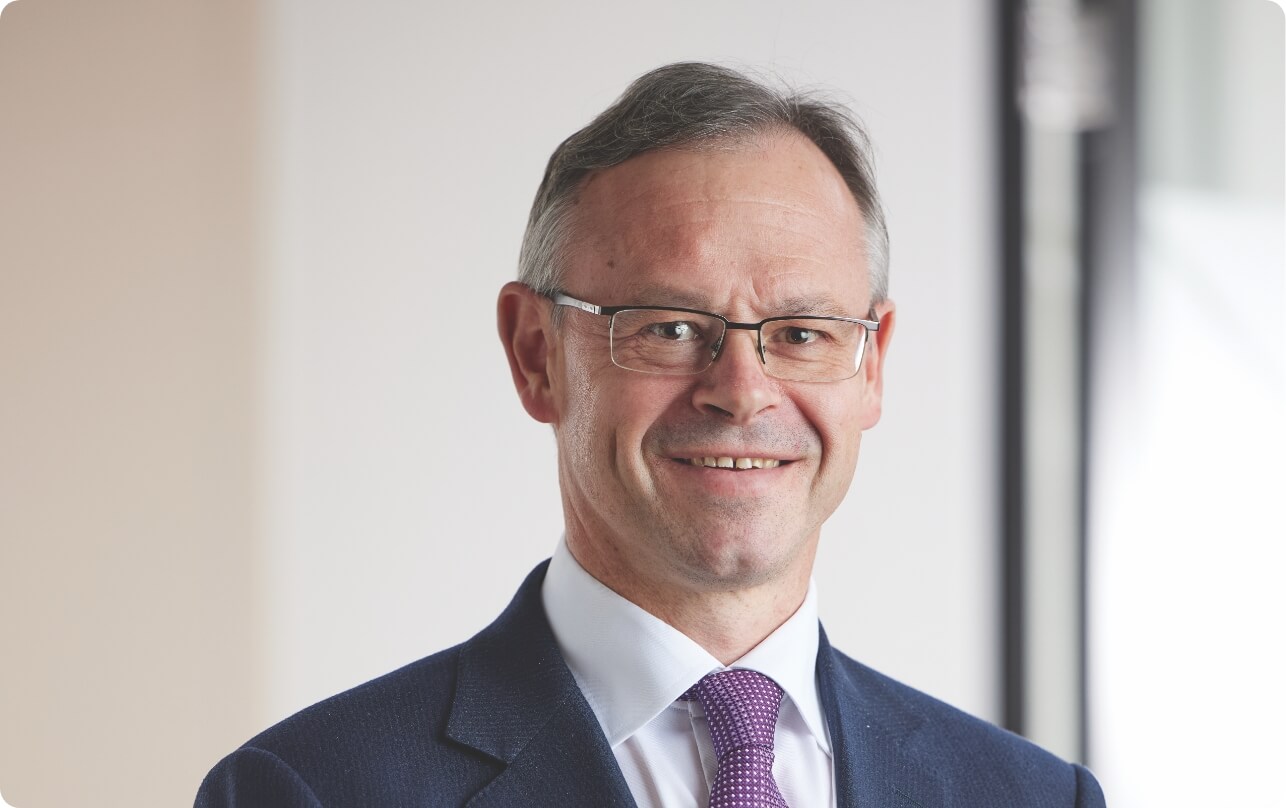
Bernard Fairman
Executive Chairman
Executive Chairman’s statement
In FY25 we achieved strong growth in AUM (+9%), revenue (+9%) and core EBITDA pre‑SBP (+5%). The Group’s focus on managing long duration capital (>90% of AUM), combined with a multi-faceted fundraising pipeline across both institutional and retail vehicles, consistently delivers growth through economic cycles. This business resilience underpins our confidence in the Group’s outlook, evidenced by our recent commitment to a share buyback programme of up to £50 million over the next three years.
On track to achieve growth guidance
Last year, having nearly tripled our core profits since the Group’s flotation in 2021, we announced updated guidance to organically double core EBITDA pre-SBP in the five years to the end of FY29. With over £1.1 billion of long duration capital raised in FY25, we are on track to deliver on that guidance.
Our strategies offer retail and institutional investors access to attractive investment opportunities, and at year end FY25, AUM reached £13.2 billion (rising from £7 billion at IPO). Over the next four years, further fundraising success across the Group’s four diversified fundraising pillars will support continued delivery against our growth ambitions:
- Institutional infrastructure: We have second vintages of two key institutional infrastructure strategies that will be seeking to capitalise on the long-term structural and regulatory tailwinds arising from global decarbonisation, energy security concerns and increasing electricity consumption requirements, particularly from AI and data centres:
- Foresight Energy Infrastructure Partners II SCSp (“FEIP II”): A growing investor and investment pipeline is supporting the Fund’s progress towards achieving the €1.25 billion final target for the second vintage of our flagship energy transition strategy, with €485 million of commitments approved to date (FEIP I closed in September 2021 at €851.4 million)
- Foresight Natural Capital II (“FNC II”): A UK and European strategy due to begin marketing in FY26 with a target fund size of €500 million, leveraging our experience across c.£250 million of Natural Capital assets today
- Retail UK tax efficient products: As a result of strong product performance and multi-year market tailwinds, we expect future annual fundraising across our business relief and VCT products to exceed the record £587 million achieved in FY25, up 35% (FY24: £436 million).
- Institutional regional private equity: Performance track record and strong regional LP relationships provide opportunities to launch further vintages of our regional strategy and deliver fundraising in line with our multi-year track record. This will further consolidate the Group’s excellent coverage of the UK and Ireland, with 15 funds currently active, and support some of the UK’s most promising smaller companies to achieve their long-term growth objectives.
- Public markets: Our Foresight Capital Management (“FCM”) division is targeting a return to growth following a period of listed market headwinds. The acquisition of the trade and assets of WHEB Asset Management LLP will aid this objective by providing product diversification, scale and future investment expertise.
Alongside this strong and diversified fundraising pipeline, the outer years of the remaining guidance period will also benefit from core EBITDA pre‑SBP margin expansion as the business scales, and deployment‑related rises to management fees. The number of funds reaching realisation phase that have the potential to earn performance fees is also expected to rise from two today to over ten by FY29.
In addition to our organic growth guidance, strategic M&A will remain an important part of our overall strategy and provides an opportunity for outperformance. We will continue to apply a disciplined approach in our assessment of these opportunities, pursuing only those that are earnings accretive.
Capital allocation
To reflect this year’s increase in core EBITDA pre-SBP, and the high levels of cash generation of the Group, the Board is recommending a final dividend of 16.8 pence per share for approval by Shareholders at the upcoming AGM. When combined with our interim dividend of 7.4 pence per share (H1 FY24: 6.7 pence per share) this gives a total dividend payment for the year of 24.2 pence per share, representing a 9% increase on prior year (FY24: 22.2 pence per share). The final dividend will be paid on 3 October 2025 based on an ex‑dividend date of 18 September 2025, with a record date of 19 September 2025.
During FY25, we also completed the remaining £15.8 million of our £17 million share buyback programme that we originally announced on 27 October 2023. On 10 April 2025 we subsequently announced a new, substantially increased, share buyback tranche of up to £50 million over the next three years. In the absence of executing accretive M&A, this up to £50 million share buyback programme, in combination with our attractive 60% dividend payout ratio, results in the efficient stewardship of capital through the return of substantially all free cash flow to Shareholders.
On behalf of the Board, I would like to thank all our colleagues for their valuable contributions to the success of the Group and for their continued efforts as we enter FY26.
Bernard Fairman
Executive Chairman
25 June 2025
Investment case
Business review
We invest in building cleaner energy systems, restoring nature and growing ambitious companies.
Investment
Infrastructure
One of Europe’s and Australia’s most established real asset investors, focusing on the energy transition, natural capital and social, transport and digital infrastructure.
Assets Under Management1
Revenue
Private Equity
We aim to be the capital provider of choice for smaller companies in the UK, Ireland and beyond. We provide Growth Private Equity, Venture Capital and Private Credit across a broad range of sectors and development stages, partnering with promising companies to help them achieve their ambitions and create long-term sustainable growth.
Assets Under Management1
Revenue
Foresight Capital Management
We leverage Foresight’s more than 40 year heritage to provide access to real assets and sustainable investment opportunities in listed markets.
Assets Under Management1
Revenue
- Alternative performance measures (“APMs”) have been included to better reflect the Group’s underlying activities. Whilst appreciating that APMs are not considered to be a substitute for, or superior to, IFRS measures, the Group believes their selected use may provide Stakeholders with additional information which will assist in their understanding of the business. In particular, the Group believes core EBITDA pre-SBP reflects the trading performance of the underlying business without distortion from the uncontrollable nature of the share‑based payments charge. Recurring revenues % is recurring revenue divided by total revenue.
Distribution
Institutional AUM
Retail AUM

FY25 was a strong year for Foresight as we make progress to achieving our target to double core EBITDA pre-SBP in the five years to FY29.
Gary Fraser
Chief Financial Officer
Financial review
For the year ended 31 March 2025
Introduction
In FY25 the Group had another successful year, achieving growth in our key performance measures. We completed the strategic acquisition of WHEB to enhance and add scale our FCM division. We had an increase in average FTE of 29 brought about by an increase in AUM but also as a function of our investment in the business to support our growth targets. We expect to achieve operating margin benefits from this increase as the business grows in areas such as institutional infrastructure for example.
Key financial metrics
| 31 March 2025 | 31 March 2024 |
|
|---|---|---|
| Period-end AUM1 (£m) | 13,195 | 12,144 |
| Retail | 4,519 | 3,741 |
| Institutional | 8,676 | 8,403 |
| Period-end FUM1 (£m) | 9,559 | 8,397 |
| Retail | 4,314 | 3,545 |
| Institutional | 5,245 | 4,852 |
| Total revenue (£000) | 153,989 | 141,326 |
| Recurring revenue1 (£000) | 133,393 | 122,372 |
| Recurring revenue/total revenue1 (%) | 86.6% | 86.6% |
| Core EBITDA pre share-based payments1 (£000) | 62,220 | 59,297 |
| Core EBITDA pre share-based payments margin1 (%) | 40.4% | 42.0% |
| Adjusted profit1 (£000) | 46,969 | 44,730 |
| Total comprehensive income (£000) | 32,040 | 24,755 |
| Basic earnings per share (pence) | 28.9 | 22.8 |
| Adjusted basic earnings per share1 (pence) | 40.8 | 38.6 |
| Dividend per share (pence) | 24.2 | 22.2 |
1. Alternative performance measures described and explained in the appendices to the financial statements.
Sustainability
We invest in the transition to a sustainable economy.
MDB alignment percentage
of our assets are in investments aligned with the Multilateral Development Banks (“MDBs”) list of activities considered universally aligned with the Paris Agreement’s mitigation goals
PRI score
Received for all completed PRI modules
Employee engagement results

Downloads
Introduction
Strategic report
Overview
- Investment case
- Business model
- Strategic priorities
- Key performance indicators
- Significant opportunities across key markets
Business review
Performance and risk
Sustainability
Governance
Financial statements
- Responsibility statement of the Directors
- Independent Auditor’s report
- Consolidated statement of comprehensive income
- Consolidated statement of financial position
- Consolidated statement of changes in equity
- Consolidated cash flow statement
- Notes to the financial statements
- Appendices to the financial statements
Additional information

